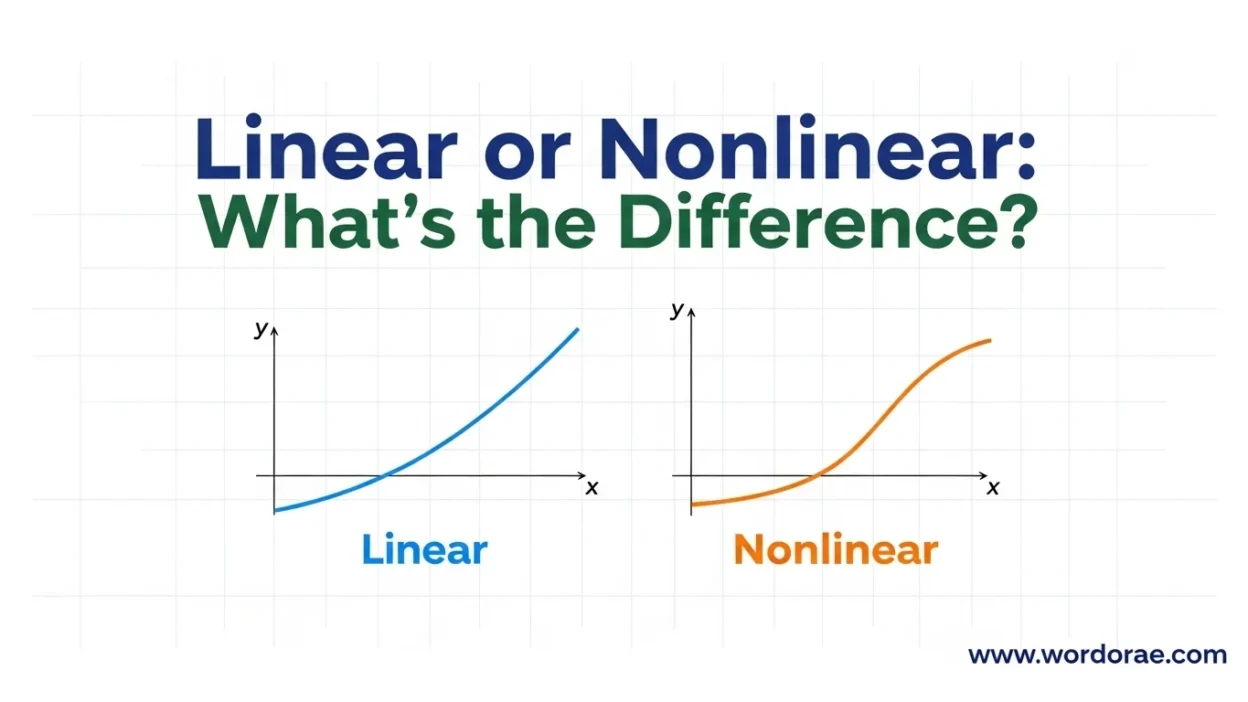
Quick answer: A linear relationship forms a straight line and changes at a constant rate, while a nonlinear relationship does not form a straight line and its rate of change varies.
If you’ve ever solved math problems or looked at graphs in school, you’ve probably wondered about linear or nonlinear functions. I know the confusion well. You might see an equation, a table, or a graph and ask yourself: Is this linear or nonlinear?
Students often search questions like how to tell if a function is linear or nonlinear, how to tell if an equation is linear or nonlinear, or even how to tell if a graph is linear or nonlinear. The confusion happens because both types involve equations and variables, but they behave very differently.
In this guide, I’ll explain everything clearly so you can quickly identify linear or nonlinear equations, functions, graphs, and tables.
Table of Contents
- Linear or Nonlinear – Quick Answer
- What Is a Linear Function?
- What Is a Nonlinear Function?
- Key Differences Between Linear and Nonlinear
- How to Tell if a Function Is Linear or Nonlinear
- How to Tell if a Graph Is Linear or Nonlinear
- How to Tell if a Table Is Linear or Nonlinear
- Linear or Nonlinear Equations and Systems
- Linear or Nonlinear in Everyday Examples
- Comparison Tables
- FAQs
- Conclusion
Linear or Nonlinear – Quick Answer
A linear function has a constant rate of change and produces a straight-line graph.
Example:
y = 2x + 3
If you graph this equation, it will create a straight line.
A nonlinear function does not have a constant rate of change, and its graph will be curved or irregular.
Example:
y = x²
When graphed, this equation forms a curve (parabola) instead of a straight line.
So the simplest rule is:
- Straight line → Linear
- Curved or changing slope → Nonlinear
What Is a Linear Function?
A linear function follows the form:
y = mx + b
Where:
- m = slope (rate of change)
- b = y-intercept
The key idea is constant change. Every time x increases by 1, y changes by the same amount.
Example:
| x | y |
|---|---|
| 1 | 3 |
| 2 | 5 |
| 3 | 7 |
The change in y is always +2, which means the relationship is linear.
Common linear equations include:
- y = x
- y = x + 2
- y = −2x
- y = x − 8
Students often ask questions like:
- Is the function y = x linear or nonlinear?
- Is the function y = x + 2 linear or nonlinear?
Both are linear because they follow the mx + b pattern.
What Is a Nonlinear Function?
A nonlinear function does not follow the mx + b format. The rate of change is not constant, which creates curves instead of straight lines.
Examples include:
- Quadratic equations
- Exponential functions
- Polynomial equations
Example:
y = x²
Table:
| x | y |
|---|---|
| 1 | 1 |
| 2 | 4 |
| 3 | 9 |
The changes are not equal, so the function is nonlinear.
Students frequently ask:
- How to know if a function is linear or nonlinear?
A quick check is to see whether the equation includes powers, roots, or multiple variables multiplied together. If it does, it’s usually nonlinear.
Differences Between Linear and Nonlinear
Here are 7 important differences with examples.
1. Graph Shape
Linear → straight line
Nonlinear → curve or irregular line
Example
Linear: y = 2x + 1
Nonlinear: y = x²
2. Rate of Change
Linear → constant rate
Nonlinear → changing rate
Example
Linear: Each step increases by +3
Nonlinear: Increase changes every step
3. Equation Form
Linear equations follow y = mx + b.
Nonlinear equations include:
- x²
- x³
- √x
- xy
Example:
Linear → y = 4x − 2
Nonlinear → y = x² + 2
4. Graph Appearance
Linear graphs always look like straight lines.
Nonlinear graphs can look like:
- curves
- parabolas
- waves
Example
Linear: y = −x
Nonlinear: y = x²
5. Table Patterns
In a linear table, the difference between y-values stays the same.
Example:
| x | y |
|---|---|
| 1 | 4 |
| 2 | 6 |
| 3 | 8 |
Difference = +2 (linear)
But if differences change, it’s nonlinear.
6. Real-Life Examples
Linear example:
Hourly wage.
If you earn $10 per hour, the increase is constant.
Nonlinear example:
Compound interest.
The amount grows faster each year.
7. Mathematical Complexity
Linear equations are simple and predictable.
Nonlinear equations often require advanced methods to solve.
Example:
Linear: y = 5x + 1
Nonlinear: y = x² − 3x + 1
How to Tell if a Function Is Linear or Nonlinear
Many students search how to tell if a function is linear or nonlinear. Use these quick steps.
Step 1: Check the equation format
If it looks like y = mx + b, it’s linear.
Example
y = 3x + 5 → linear
Step 2: Look for exponents
If the equation includes powers like x², it is nonlinear.
Example
y = x² + 1 → nonlinear
Step 3: Check the graph
Straight line → linear
Curve → nonlinear
Step 4: Use a linear or nonlinear calculator
Many online tools called linear or nonlinear calculators help confirm whether an equation is linear.
How to Tell if a Graph Is Linear or Nonlinear
A graph is linear if all points lie on a straight line.
Example:
|
|       *
|    *
| *
|____________
A nonlinear graph bends or curves.
Example:
|
|      *
|   *
| *
|   *
|      *
|____________
Students often ask how to tell if a graph is linear or nonlinear. The answer is simple: check whether the slope stays constant.
How to Tell if a Table Is Linear or Nonlinear
To determine how to tell if a table is linear or nonlinear, calculate the differences between y-values.
Example linear table:
| x | y |
|---|---|
| 1 | 2 |
| 2 | 4 |
| 3 | 6 |
Change = +2 each time.
Example nonlinear table:
| x | y |
|---|---|
| 1 | 1 |
| 2 | 4 |
| 3 | 9 |
Changes: +3 then +5 → nonlinear.
Linear or Nonlinear Equations and Systems
A linear equation contains only first-degree variables.
Example:
2x + y = 5
A nonlinear equation includes higher powers or variable products.
Example:
x² + y = 7
A linear or nonlinear system refers to multiple equations solved together.
Example linear system:
x + y = 5
x − y = 1
Example nonlinear system:
x² + y = 6
x + y = 4
Linear or Nonlinear in Everyday Examples
Understanding linear or nonlinear relationships helps in many real-world areas.
Physics
Speed vs time can be linear when acceleration is constant.
Economics
Compound interest produces nonlinear growth.
Technology
Machine learning often relies on nonlinear models.
Science
Population growth often follows nonlinear patterns.
Comparison Table: Linear vs Nonlinear Functions
| Feature | Linear | Nonlinear |
|---|---|---|
| Graph | Straight line | Curve |
| Rate of change | Constant | Changing |
| Equation form | y = mx + b | Many forms |
| Complexity | Simple | Complex |
| Examples | y = 2x | y = x² |
Comparison Table: How to Identify Them
| Method | Linear | Nonlinear |
|---|---|---|
| Equation check | mx + b | Other forms |
| Graph check | Straight line | Curve |
| Table check | Equal differences | Unequal differences |
| Real-world pattern | Constant change | Variable change |
Linear vs Nonlinear Graph Example
Another easy way to understand linear or nonlinear functions is by looking at graphs.
A linear graph always forms a straight line. The rate of change stays the same across the graph.
Example equation:
y = 2x + 1
This produces a straight line.
A nonlinear graph forms a curve. The rate of change keeps changing.
Example equation:
y = x²
This produces a curved shape called a parabola.
If the graph is straight, the function is linear. If it curves or bends, the function is nonlinear.
FAQs
Is the function y = x linear or nonlinear?
It is linear because it forms a straight line and has a constant slope of 1.
Is the function y = −x linear or nonlinear?
It is linear. The slope is −1, but the rate of change is still constant.Is the function y = x − 2 linear or nonlinear?
It is linear because it follows the y = mx + b pattern.
Is the function y = −2x linear or nonlinear?
This is also linear since the variable only has a power of 1.
How to tell if an equation is linear or nonlinear?
Check whether variables have powers greater than 1 or are multiplied together. If they are, the equation is nonlinear.
What is a linear or nonlinear worksheet?
A linear or nonlinear worksheet is a practice exercise where students classify equations, graphs, and tables as linear or nonlinear.
How to know if something is linear or nonlinear?
Look for a constant rate of change. If the change stays consistent, the relationship is linear.
Conclusion
If you have ever wondered whether something is linear or nonlinear, the key is to look at patterns. A linear function follows a simple rule and forms a straight line. A nonlinear function changes its rate and creates curves.
I always recommend checking three things: the equation, the graph, and the table of values. If the equation follows y = mx + b, the relationship is linear. If powers like x² or x³ appear, it is nonlinear.
For students, this skill becomes very important in algebra and data analysis. Once you practice recognizing the patterns, telling whether something is linear or nonlinear becomes much easier.
When you understand the difference, graphs, equations, and functions will make much more sense.

I’m Helena Marwick, a grammar-focused writer at Wordorae.com, where I help readers understand confusing English words and usage clearly.
I specialize in making grammar simple, accurate, and easy to apply in everyday writing.